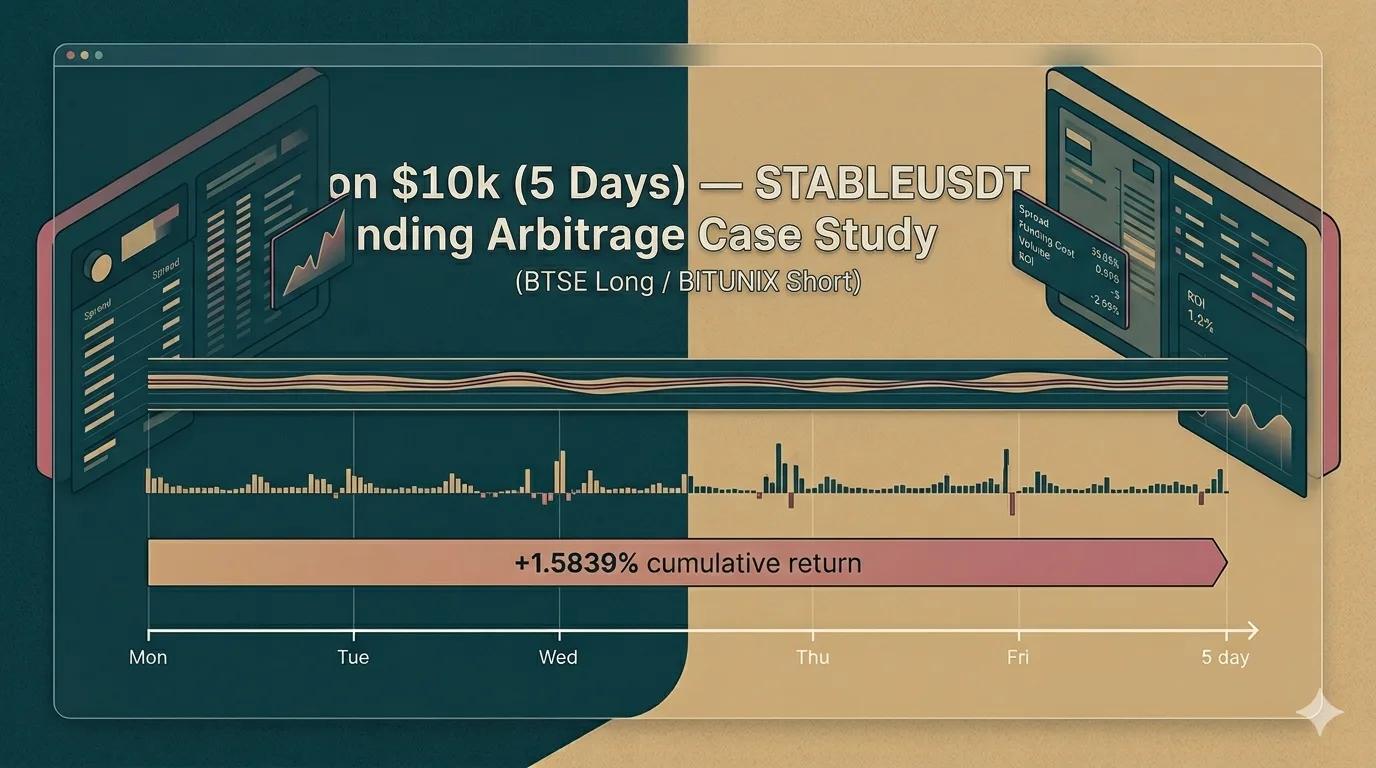
Client made more than $158.39 on $10k (5 Days) — STABLEUSDT Funding Arbitrage (BTSE Long / BITUNIX Short)
This article is built from real funding rates logged for STABLEUSDT on BTSE and BITUNIX over May 6–May 10, 2026 (newest timestamps first below) — not a fabricated example.
Funding rate arbitrage on stablecoin perpetuals sits in arbitrage perpetuals workflows: traders earn from funding rate differences crypto arbitrage between exchanges while keeping spot exposure broadly neutral across the hedge. Live Crypto Arbitrage and Arbitrage Profits help you hunt similar CEX arbitrage prints; this post locks the numbers to one BTSE vs BITUNIX window.
Strategy: BTSE Long / BITUNIX Short. Cumulative funding carry in this capture was +1.5839% on position value before fees, which scales to about $158.39 on a $10,000 benchmark position value — i.e. the crypto arbitrage earnings you would have targeted from funding alone if you had run this hedge through the same span (fees, spread tracking costs, and execution would lower realized P/L).
Headline outcome in this dataset: $158.39 on $10,000 from accumulated funding over the window (+1.5839% cumulative), before fees.
Funding cycle
From the interval log below, this capture reflects different funding cycles: BTSE STABLEUSDT runs on a 1-hour cycle, and BITUNIX STABLEUSDT runs on a 4-hour cycle (BITUNIX publishes funding % on part of the timeline over the same calendar span—consistent with a slower cadence than hourly BTSE, not a broken export). Confirm live contract specs on each exchange.
When funding schedules differ
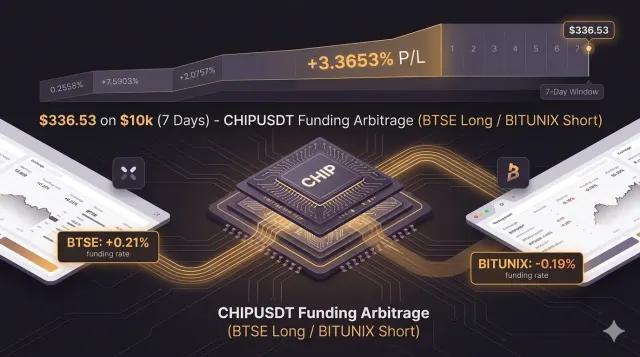
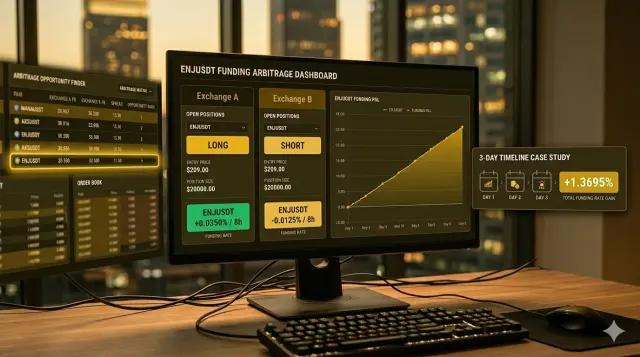
If BITUNIX used the same 1-hour rhythm as BTSE, you could receive or pay funding more often on both sides of the hedge in principle; keep that comparison short. In practice you still trade the intervals you get—use Alerts (negative projection, cycle PnL / risk projection) when carry weakens, and Portfolio Management to match position sizes on BTSE and BITUNIX through 1-hour versus 4-hour settlements. Mixed-cadence reference: ENJUSDT case study. When both exchanges share one 4-hour funding schedule throughout, see CHIPUSDT case study.
Full interval log (BTSE Long / BITUNIX Short)
Funding columns show published funding % per row. The interval P/L column is the strategy’s incremental result (%). The Total row is the cumulative funding return % from the export.
| Date | BITUNIX funding % | BTSE funding % | Interval P/L % (BTSE Long / BITUNIX Short) |
|---|---|---|---|
| 5/10/2026, 7:30:00 PM | — | -0.0535% | +0.0535% |
| 5/10/2026, 6:30:00 PM | — | -0.0446% | +0.0446% |
| 5/10/2026, 5:30:00 PM | -0.0127% | -0.0541% | +0.0415% |
| 5/10/2026, 4:30:00 PM | — | -0.0021% | +0.0021% |
| 5/10/2026, 3:30:00 PM | — | -0.0711% | +0.0711% |
| 5/10/2026, 2:30:00 PM | — | -0.0429% | +0.0429% |
| 5/10/2026, 1:30:00 PM | -0.0074% | -0.1086% | +0.1012% |
| 5/10/2026, 12:30:00 PM | — | -0.0381% | +0.0381% |
| 5/10/2026, 11:30:00 AM | — | -0.0099% | +0.0099% |
| 5/10/2026, 10:30:00 AM | — | -0.0507% | +0.0507% |
| 5/10/2026, 9:30:00 AM | -0.0074% | -0.0072% | -0.0002% |
| 5/10/2026, 8:30:00 AM | — | -0.0297% | +0.0297% |
| 5/10/2026, 7:30:00 AM | — | -0.011% | +0.011% |
| 5/10/2026, 6:30:00 AM | — | -0.0091% | +0.0091% |
| 5/10/2026, 5:30:00 AM | -0.0271% | -0.032% | +0.005% |
| 5/10/2026, 4:30:00 AM | — | -0.0315% | +0.0315% |
| 5/10/2026, 3:30:00 AM | — | -0.0411% | +0.0411% |
| 5/10/2026, 2:30:00 AM | — | -0.0114% | +0.0114% |
| 5/10/2026, 1:30:00 AM | -0.0015% | -0.0225% | +0.0209% |
| 5/10/2026, 12:30:00 AM | — | -0.0122% | +0.0122% |
| 5/9/2026, 11:30:00 PM | — | -0.0212% | +0.0212% |
| 5/9/2026, 10:30:00 PM | — | 0.0002% | -0.0002% |
| 5/9/2026, 9:30:00 PM | 0.0019% | -0.0263% | +0.0283% |
| 5/9/2026, 8:30:00 PM | — | -0.0858% | +0.0858% |
| 5/9/2026, 7:30:00 PM | — | -0.0299% | +0.0299% |
| 5/9/2026, 6:30:00 PM | — | -0.0224% | +0.0224% |
| 5/9/2026, 5:30:00 PM | 0.004% | 0.0013% | +0.0027% |
| 5/9/2026, 4:30:00 PM | — | -0.0044% | +0.0044% |
| 5/9/2026, 3:30:00 PM | — | -0.0072% | +0.0072% |
| 5/9/2026, 2:30:00 PM | — | -0.0263% | +0.0263% |
| 5/9/2026, 1:30:00 PM | 0.004% | -0.0493% | +0.0533% |
| 5/9/2026, 12:30:00 PM | — | -0.0305% | +0.0305% |
| 5/9/2026, 11:30:00 AM | — | -0.0711% | +0.0711% |
| 5/9/2026, 10:30:00 AM | — | 0.0013% | -0.0013% |
| 5/9/2026, 9:30:00 AM | 0% | 0.0013% | -0.0013% |
| 5/9/2026, 8:30:00 AM | — | 0.0013% | -0.0013% |
| 5/9/2026, 7:30:00 AM | — | 0.0013% | -0.0013% |
| 5/9/2026, 6:30:00 AM | — | 0.0013% | -0.0013% |
| 5/9/2026, 5:30:00 AM | -0.0397% | 0.0013% | -0.0409% |
| 5/9/2026, 4:30:00 AM | — | -0.0073% | +0.0073% |
| 5/9/2026, 3:30:00 AM | — | -0.0134% | +0.0134% |
| 5/9/2026, 2:30:00 AM | — | -0.1126% | +0.1126% |
| 5/9/2026, 1:30:00 AM | -0.0227% | -0.0305% | +0.0077% |
| 5/9/2026, 12:30:00 AM | — | 0.0013% | -0.0013% |
| 5/8/2026, 11:30:00 PM | — | -0.0333% | +0.0333% |
| 5/8/2026, 10:30:00 PM | — | -0.076% | +0.076% |
| 5/8/2026, 9:30:00 PM | -0.0172% | -0.0503% | +0.0331% |
| 5/8/2026, 8:30:00 PM | — | 0.0013% | -0.0013% |
| 5/8/2026, 7:30:00 PM | — | -0.0151% | +0.0151% |
| 5/8/2026, 6:30:00 PM | — | -0.0203% | +0.0203% |
| 5/8/2026, 5:30:00 PM | -0.0277% | -0.0157% | -0.0121% |
| 5/8/2026, 4:30:00 PM | — | 0.0013% | -0.0013% |
| 5/8/2026, 3:30:00 PM | — | -0.0321% | +0.0321% |
| 5/8/2026, 2:30:00 PM | — | 0.0013% | -0.0013% |
| 5/8/2026, 1:30:00 PM | -0.0227% | 0.0013% | -0.0239% |
| 5/8/2026, 12:30:00 PM | — | -0.0077% | +0.0077% |
| 5/8/2026, 11:30:00 AM | — | -0.0093% | +0.0093% |
| 5/8/2026, 10:30:00 AM | — | -0.0065% | +0.0065% |
| 5/8/2026, 9:30:00 AM | -0.0187% | -0.0058% | -0.0129% |
| 5/8/2026, 8:30:00 AM | — | -0.0081% | +0.0081% |
| 5/8/2026, 7:30:00 AM | — | -0.0067% | +0.0067% |
| 5/8/2026, 6:30:00 AM | — | -0.0059% | +0.0059% |
| 5/8/2026, 5:30:00 AM | -0.0198% | -0.0062% | -0.0136% |
| 5/8/2026, 4:30:00 AM | — | -0.0128% | +0.0128% |
| 5/8/2026, 3:30:00 AM | — | -0.0164% | +0.0164% |
| 5/8/2026, 2:30:00 AM | — | -0.0152% | +0.0152% |
| 5/8/2026, 1:30:00 AM | -0.0252% | -0.0082% | -0.017% |
| 5/8/2026, 12:30:00 AM | — | -0.0074% | +0.0074% |
| 5/7/2026, 11:30:00 PM | — | -0.0027% | +0.0027% |
| 5/7/2026, 10:30:00 PM | — | -0.0053% | +0.0053% |
| 5/7/2026, 9:30:00 PM | -0.0397% | -0.0124% | -0.0273% |
| 5/7/2026, 8:30:00 PM | — | 0.0013% | -0.0013% |
| 5/7/2026, 7:30:00 PM | — | -0.019% | +0.019% |
| 5/7/2026, 6:30:00 PM | — | -0.0229% | +0.0229% |
| 5/7/2026, 5:30:00 PM | -0.0367% | -0.0085% | -0.0282% |
| 5/7/2026, 4:30:00 PM | — | -0.0548% | +0.0548% |
| 5/7/2026, 3:30:00 PM | — | -0.0895% | +0.0895% |
| 5/7/2026, 2:30:00 PM | — | -0.0614% | +0.0614% |
| 5/7/2026, 1:30:00 PM | -0.0178% | 0.0013% | -0.019% |
| 5/7/2026, 12:30:00 PM | — | 0.0013% | -0.0013% |
| 5/7/2026, 11:30:00 AM | — | -0.0125% | +0.0125% |
| 5/7/2026, 10:30:00 AM | — | -0.0021% | +0.0021% |
| 5/7/2026, 9:30:00 AM | -0.0142% | -0.04% | +0.0258% |
| 5/7/2026, 8:30:00 AM | — | -0.0684% | +0.0684% |
| 5/7/2026, 7:30:00 AM | — | -0.0153% | +0.0153% |
| 5/7/2026, 6:30:00 AM | — | 0.0013% | -0.0013% |
| 5/7/2026, 5:30:00 AM | 0.0009% | 0.0013% | -0.0003% |
| 5/7/2026, 4:30:00 AM | — | 0.0013% | -0.0013% |
| 5/7/2026, 3:30:00 AM | — | 0.0013% | -0.0013% |
| 5/7/2026, 2:30:00 AM | — | 0.0013% | -0.0013% |
| 5/7/2026, 1:30:00 AM | -0.0164% | 0.0013% | -0.0176% |
| 5/7/2026, 12:30:00 AM | — | 0.0013% | -0.0013% |
| 5/6/2026, 11:30:00 PM | — | 0.0013% | -0.0013% |
| 5/6/2026, 10:30:00 PM | — | 0.0013% | -0.0013% |
| 5/6/2026, 9:30:00 PM | 0.0025% | 0.0013% | +0.0012% |
| 5/6/2026, 8:30:00 PM | — | 0.0013% | -0.0013% |
| 5/6/2026, 7:30:00 PM | — | 0.0013% | -0.0013% |
| 5/6/2026, 6:30:00 PM | — | 0.0013% | -0.0013% |
| 5/6/2026, 5:30:00 PM | -0.0082% | -0.0127% | +0.0045% |
| 5/6/2026, 4:30:00 PM | — | 0.0013% | -0.0013% |
| 5/6/2026, 3:30:00 PM | — | 0.0013% | -0.0013% |
| 5/6/2026, 2:30:00 PM | — | 0.0013% | -0.0013% |
| 5/6/2026, 1:30:00 PM | -0.0045% | 0.0013% | -0.0057% |
| 5/6/2026, 12:30:00 PM | — | 0.0013% | -0.0013% |
| 5/6/2026, 11:30:00 AM | — | 0.0013% | -0.0013% |
| 5/6/2026, 10:30:00 AM | — | -0.014% | +0.014% |
| 5/6/2026, 9:30:00 AM | -0.0116% | 0.0013% | -0.0129% |
| 5/6/2026, 8:30:00 AM | — | -0.0071% | +0.0071% |
| 5/6/2026, 7:30:00 AM | — | -0.009% | +0.009% |
| 5/6/2026, 6:30:00 AM | — | -0.0114% | +0.0114% |
| 5/6/2026, 5:30:00 AM | -0.0265% | -0.0082% | -0.0183% |
| 5/6/2026, 4:30:00 AM | — | -0.0044% | +0.0044% |
| 5/6/2026, 3:30:00 AM | — | -0.0048% | +0.0048% |
| 5/6/2026, 2:30:00 AM | — | -0.009% | +0.009% |
| 5/6/2026, 1:30:00 AM | -0.0513% | -0.0155% | -0.0358% |
| Total (cumulative funding return) | — | — | +1.5839% |
Cumulative +1.5839% on position value ≈ $158.39 at $10,000 before fees.
What this window shows
BTSE funding skewed negative more often than BITUNIX in this slice, so paying/receiving balanced out in favor of BTSE Long / BITUNIX Short over the full five-day capture. A few intervals flip slightly against the carry (for example small +0.0013% BTSE prints with flat BITUNIX quotes); the cumulative +1.5839% is what mattered for the hedge. The strongest positive interval P/L entries in this log are about +0.1126% and +0.0895%, when funding rate tracking would have flashed wider cross-exchange divergence.
Traders often pair free funding rate tracking views with a crypto arbitrage scanner workflow to screen futures arbitrage ideas before sizing — ArbiSight’s Orderbook Snapshot is useful for confirming depth when you escalate from screen to execution.
Same cumulative % at different position values
Scaling the +1.5839% return by position value (before fees):
| Position value | ~Funding P/L (same window, before fees) |
|---|---|
| Starter size ($500) | ~$7.92 |
| Light deployment ($1,000) | ~$15.84 |
| Mid size ($5,000) | ~$79.19 |
| Benchmark ($10,000) | ~$158.39 |
Caveats
Past funding does not forecast future funding — regimes flip, fees bite, and operational risk matters. Validate live funding, margin, and contract rules before allocating.
Run this workflow in ArbiSight
- Live Crypto Arbitrage — free crypto arbitrage scanner-style discovery
- Arbitrage Profits — crypto arbitrage tools lens on historical carry
- Orderbook Snapshot
- Portfolio Management
- Alerts — free funding rate alerts / projection-driven exits when credible for your tier
Disclaimer: Educational material only; not financial advice. Live markets differ from any historical capture.